


Science & Data
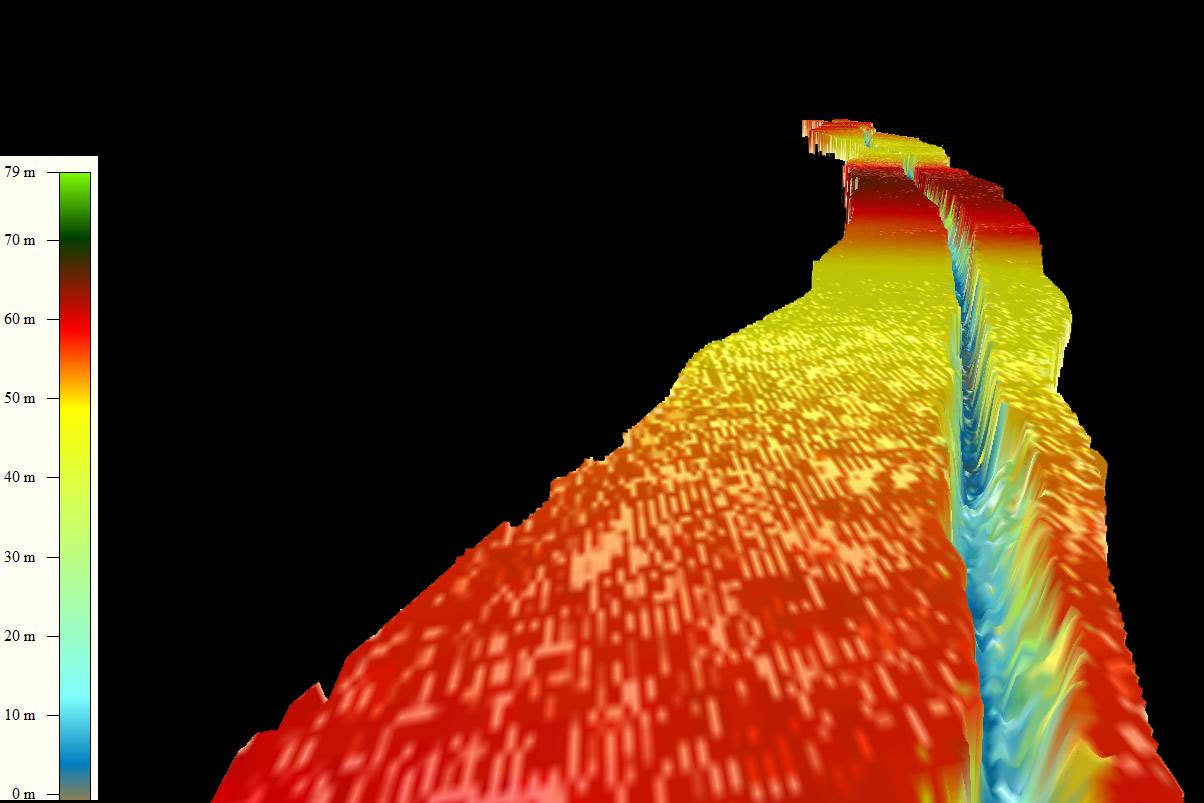
Representation of a rift in Antarctica’s Pine Island Glacier generated from ATM data
Through its stated mission objectives and science goals, IceBridge is working to answer several specific science questions:
- Where are glaciers thinning?
- What is causing ice sheets to lose mass and change velocity?
- How much snow accumulates on the ice sheets?
- How is sea ice changing?
- How accurate do sea ice observations need to be for forecasting?
- What is the best way to measure sea ice thickness, freeboard and snow depth?
- How do ice, the ocean and the atmosphere interact with each other?
To answer these questions, IceBridge gathers a wide variety of data that is freely available to researchers and the general public via the National Snow and Ice Data Center’s IceBridge Data Portal. For a video tutorial on using the NSIDC data portal, go to the NASA Earth data webinar archive and scroll down to the Sept. 25, 2013 entry on IceBridge.
With a decade worth of data collected, researchers are now beginning to publish science results using IceBridge data.
Science Results
Measurements by operation IceBridge fill in a crucial gap left between the end of the ICESat mission and the upcoming launch of ICESat-2 scheduled to launch in 2018. Although valuable in its ability to keep ICESat’s record of measurements continuing, a big advantage of IceBridge is its ability to gather data that allows scientists to better understand how a changing climate affects polar ice.
With higher spatial resolution, a wide array of instruments and the ability to go where scientifically relevant data lies, IceBridge has grown and improved the data set started with ICESat. IceBridge data have improved knowledge of the topography of bedrock beneath ice, shown that glacier thinning rates have increased, and allowed researchers to predict future glacier discharge speed. Among the aims of this research are predicting sea level increases caused by a changing climate and making more accurate forecasts of annual sea ice extent.
In addition, IceBridge has taken on an important role in efforts to validate data gathered by the European Space Agency’s ice-monitoring satellite, CryoSat-2, and will pave the way for NASA’s ICESat-2, which is scheduled to launch in 2016.
Sea Ice
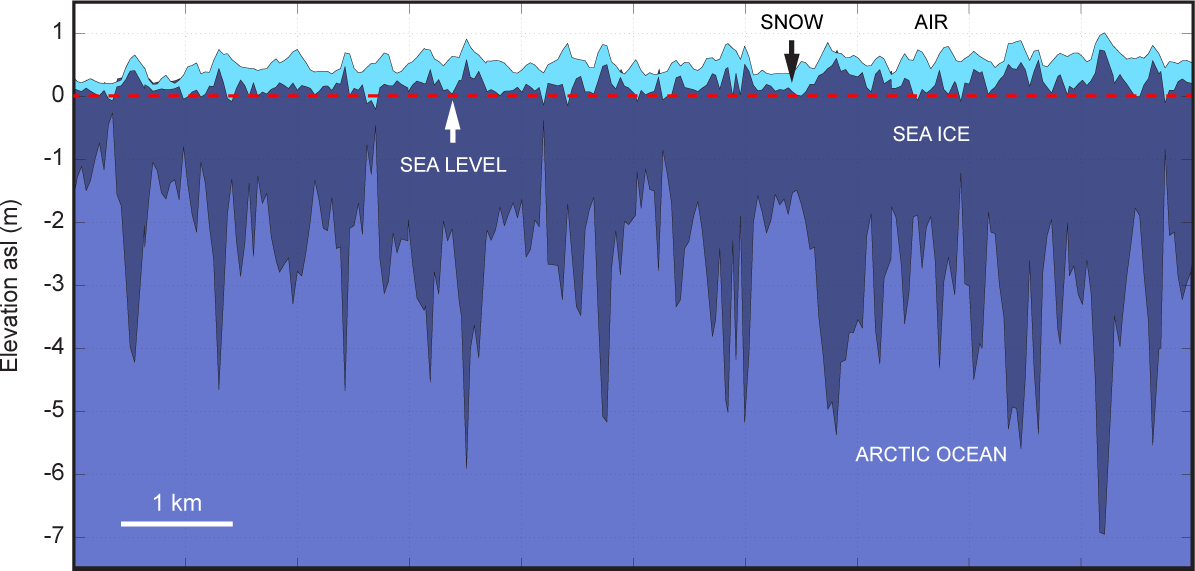
Idealized profile of snow-covered sea ice in the Arctic Ocean.
There are a few key questions when it comes to sea ice. When will we reach the seasonal maximum this year? How is thickness and extent changing from year to year? How accurate are our measurements? By using a suite of instruments, IceBridge is able to answer these questions. The biggest advances in sea ice science coming from IceBridge involve snow thickness over Arctic sea ice and sea ice freeboard, the height of ice and snow protruding above the ocean’s surface.
Only a small portion of sea ice is above the water, so knowing how much of the freeboard is snow and how much is actually ice makes sea ice thickness measurements more accurate and reliable. IceBridge scientists are using a large and growing data set to publish sea ice thickness results that can be found on the National Snow and Ice Data Center’s website.
In addition, IceBridge scientists are using rapid-turnaround production methods to create a “quick-look” sea ice product in the Arctic, with the aim of providing a view of ice thickness, snow depth and surface roughness only a month after the data is collected. These data products are designed to be used in time-sensitive applications such as sea ice forecasting.
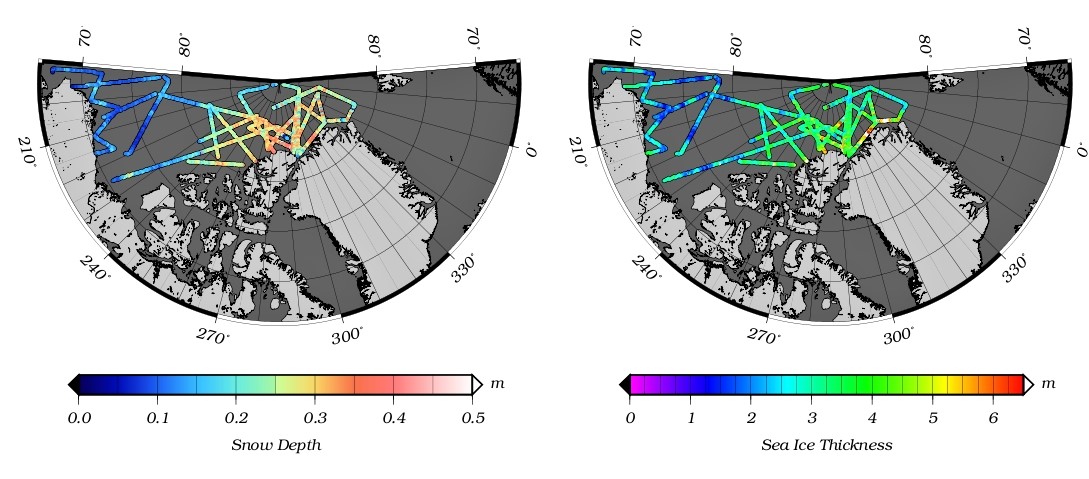
Maps of Arctic sea ice thickness and snow depth along flight tracks during the 2012 Arctic Spring campaign.
Ice Sheets and Glaciers
The Greenland and Antarctic glaciers are mostly thinning and speeding up, which we have only been able to continue to observe through IceBridge. This project is gathering data on the elevation and thickness of ice as well as information about the bedrock and water beneath ice sheets, ice shelves and glaciers. Bedrock type often affects glacier flow speed and water flowing under ice shelf margins can speed up ice thinning.
Such information is used to model the flow of ice in rapidly changing areas such as Greenland’s Jakobshavn Glacier and the Pine Island Glacier in Antarctica. Robert Thomas’s paper in Geophysical Research Letters explores such ice loss in detail and an animation from the Scientific Visualization Studio at NASA’s Goddard Space Flight Center shows the complex and non-linear nature of ice elevation change.